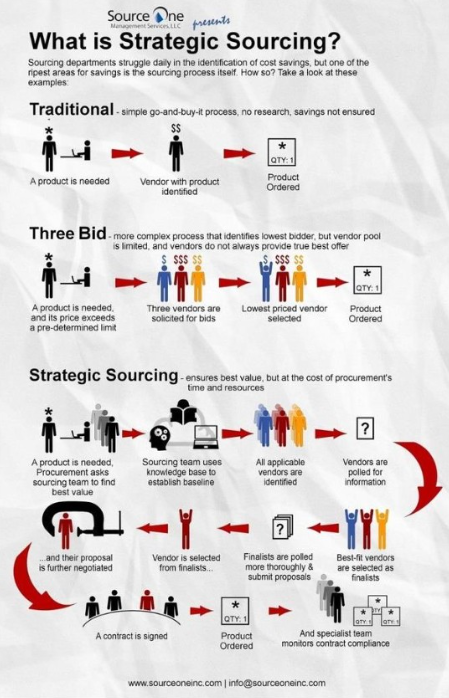
The post that I did on Friday, January 12 was the second time I have used the same visual. What was different was that a lot more people viewed the image, commented, and reshared it.
Getting almost 150,000 impressions in one week is outstanding. Feedback with 840 likes, 50 comments, and 113 reposts is spectacular.
What did I learn? That the topic is most likely more relevant now than it might have been 5 years ago. I wanted to see insights so I looked at the demographics of who was engaged and you will see the analytics on the second page of the pdf document.
I also wanted to see which terms were trending when people did internet searches. And it would seem that the hot space right now is distribution. I should not have been surprised based on the number of new warehouses being built and trucks on the road.

Categories:
Tags:


Comments are closed